The Regional Stock Exchange (BRVM) recorded its third largest decline in its history at -16.81% in 2017 against 25.89% in 2009. In this file, Daniel Aggre and Ahmed Diallo, experts from the Sikadvisory firm deliver their analysis of the events that impacted the BRVM in 2017.
As early as January 2017, the market was punctuated by negative elements in economic, political and security terms. Side values, only eight (8) companies were able to pull out of the game while the others were swept by a wave of panic investors. The latter will surf elsewhere throughout the year in the red.
Our study on the decline of the BRVM will be done in three (3) parts. In this first part, we will analyze the events that impacted the BRVM. In the next article, we will present a sectoral study as well as the largest variations of listed companies. Then
perspectives of the year 2018 according to the fund managers of the market, will close this file.
Analysis of events impacting the BRVM
“You have to expect the unexpected on the stock market, get ready for the extremes.” Said Richard Dennis the man who turned $ 400 into $ 200 million in twenty years at the Chicago Mercantile Exchange. This maxim summarizes the volatility of any financial market and the difficulty of predicting or anticipating the exogenous factors that may influence the stock market. Especially in our African markets still fragile because of political and security events.
2017, it must be admitted, was the most disconcerting year that the BRVM has seen in recent years. Who at the beginning of the year could have predicted the mutiny in Ivory Coast? Not many.
Who had predicted the fall of cocoa and coffee prices? Nobody, not even the Ivorian president who was the first surprised. Who predicted the scale of the ag-business scandal? Few people indeed; While these companies managed to mobilize about 100 billion FCFA (152 million) from more than 40 000 underwriters.
Yet these events have been good and well produced and have probably had repercussions on the BRVM. Or, at least they have been catalysts in a natural market correction after an average growth of 16.87% since 2012. But it must be recognized, the decline of the BRVM surprised everyone.
One of the worst years at the BRVM
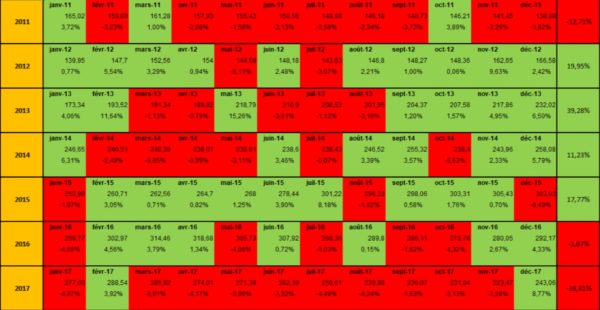
In detail, in monthly data, it should be noted that the seasonal graph of BRVM Composite in this year 2017, is one of the worst that the stock market has recorded.
Seasonal Chart of Growth of BRVM Composite from 20111 to 2017

It is found that on lex ten (10) of the twelve (12) of the year, the market shows a loss with a sequence of nine (9) consecutive months. January-April-July-August 2017, are the months that recorded the largest decline, with a fall of + 4.00%. This raises several questions. What could have happened during this period on the stock market? How have investors and market specialists responded to this decline?
Which sector was most affected?
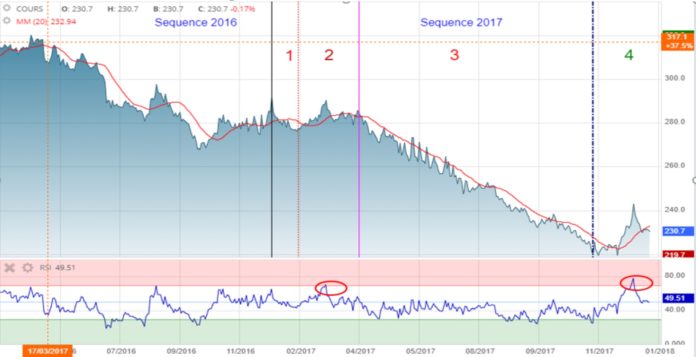
Evolution of the BRVM composite index from 2016 to 2017
On this chart, we observe 4 phases during the 2017 year. The 1e phase running from the 2 to the January 31 indicates a sharp decline. Then, there is a slight increase during the 2 th phase of 31 January to 3 April. Then, we observe a sharp prolonged decline on 8 months from April 3 to November 21. Finally, the 4th phase recorded a sharp rise over the short term from 21 November to 31 December.
1 phase-January 2017: the worst month of the BRVM
For more than ten (10) years, no month in January had been so devastating for investors on the Regional Stock Exchange. In 2016, some market correction had already begun. In addition, several shareholders had begun to recover the profits earned in previous years. Then, comes January 2017.
However, if we look closely at it, we realize that 3 major events were at the basis of this historical fact at the BRVM.
In the night of 5 at 6 January 2017, a mutiny broke out in Bouaké in the second largest city on the Ivory Coast and spread to several military barracks in the country. According to press reports, the mutineers are demanding payment of their wartime bonuses, salary increases and faster promotion between grades.
During the same morning of January 6, the accounts of companies in the agribusiness are frozen. This, after a first intervention of the State of Côte d’Ivoire through the General Directorate of Treasury and Public Accounting, 22 September 2016.
This situation will mark the beginning of several demonstrations by the subscribers of these companies, in Abidjan. Three (3) days later, ie Monday, January 9, Ivorian officials begin a multi-day strike. They demand the payment of the stock of premium and salary arrears as well as the change in the method of calculating pensions.
No stock market in the world can prosper with such negative economic events. All of this naturally affected companies in the distribution, transport and agriculture sectors. These sectors are strongly correlated with the economic activity of Côte d’Ivoire.
In its quarterly publication on Ivorian economic activity, the National Institute of Statistics (INS), says that the country’s GDP has recorded a growth of 7.2% at 1er quarter 2017. But to look at it, we see that the sectors of the main listed companies are down. Thus, the agro-food industries lose 1.4% during this period and those of the trade are down by 0.5%. On the other hand, the transport sector recorded a slight increase of 2%.
On the BRVM, we realize that the market decline is much more brutal in January, or -4,97%. The distribution sector lost 14.78% during the month of January, followed by the transport sector (-9.28%), the agriculture sector (-8.10%) and the public service sector (-5.07%).
2017 Year Strangely Like 2011
Hypothesis : The security situation must have slowed down some international and national investors.
Looking at the monthly seasonal chart, we find that the 2017 year is strangely similar to that of 2011, a year of post-election crisis in Côte d’Ivoire.
We note 3 month rise in 2011 against 2 month rise in 2017. Let 8 be negative growth months in 2011 against 10 months in 2017. We can thus establish a similarity, which should not have escaped investors very watchful on the security field of this country where are 35 45 companies listed on the BRVM.
Since 2 consecutive years, the month of January has always been a drop and social unrest has just accentuated this state of affairs.
This same graph also reveals a record increase in the month of December. Some investors prefer to recover their profit in January and wait for the decline of the market to better position themselves at the exit of the results of companies.
Investors facing military and social turbulence always play caution.
2eme phase:
From January 31 to April 3, we see a slight consolidation of the market on at least 2 me and then a slight rise in the market. The market is above its moving average and there is even a zone of over-buying in March.
Hypothesis : The month of February has always been green on the last 3 years. The Ivorian Government has been able to communicate on the agreement reached with the mutineers has restored confidence to all investors. The stock market has naturally returned to growth in the majority of sectors.
3eme phase –
April 2017: Announcement of the budget cut by the Ivorian government: the BRVM loses 4.17%
On Thursday 30 March the government spokesman, Bruno Koné, at the end of a council of ministers, announces that the continued fall in cocoa prices has severely affected the country’s tax revenues. As a reminder, the price of the bean had fallen by 30% since October 2016. This has impacted the national budget, part of which is fueled by cocoa taxation and has increased the budget deficit to 5%. One (1) months later, the Ivorian government announced a downward revision of the budget.
Hypothesis : The announcement of the budget cut prompted some investors to be cautious and out of their positions. Thus, the communication of the Ivorian government on the launch of a EUROBOND in view of coping with the fall in the budget and the PND (National Investment Plan) has no doubt allowed foreign investors to redirect their funds to the region. EUROBOND in order to secure their investments.
We interviewed the fund managers (SICAV, FCP) of the region, on the conduct adopted when they noted the decline of the market. 80% of these managers divested at the end of the first quarter of the equity market and strengthened their positions in the bond market. They sold at least 5% of their equity portfolio on average.
In fact, the capitalization of the bond market recorded double-digit growth, ie + 18,34% to 2 978 billion FCFA in 2017
June 2017 – July-August 2017: OPV from NSIA bank and market decline
July and August 2017 are down more than 4%. At this time of the year, two major events punctuated the BRVM.
The 1er event concerns announced dividends:
After 3 months in a row in the red (March – April – May), the total dividends announced by listed companies is lower than the previous year. And this, after the publication of all the annual reports of listed companies with the exception of AIR LIQUIDE and MOVIS.
In 2016, the companies announced the distribution of about 349 billion FCFA (by integrating the announced dividends of ETI TG) against 347 billion FCFA in 2017. This despite the integration of 5 additional companies compared to 2015.
By ignoring 5’s new integrated companies in 2016, the decline in announced dividends is increasing by about 9%.
Hypothesis : This market is really focused on the payment of dividends. So logically a distribution below the expectations of shareholders is immediately sanctioned by them.
OPV destabilizing factor of the market?
The 2th event concerns the announcement of the NSIA OPV (Public Sales Offer).
On Tuesday 27 June 2017, NSIA Bank announces at a press conference the launch of a public offering of 4 million shares. The operation launched the 03 July, is a success because all shares offered for sale are bought in one day.
During the same month of June, the BRVM recorded the second largest number of volumes traded on the year, 41 079 875 securities. While the month of July records the lowest transaction of the year.
Hypothesis : There is every reason to believe that NSIA’s OPV played a role in the market downturn at this time of year.
Indeed, the number of volumes traded during the month of June seems to indicate that many investors have sold their shares to build capital to participate in the NSIA OPV, expected for over 2 years. This translates the low volume of 3,8 million in July against 41 million in June.
The 3 th event concerns poor communication related to capital increases of BOAs.
In June 2017, BOA’s subsidiaries carry out a series of capital increases by incorporating share premiums. As well as postponements again by creating new share and free share distribution.
Thus, the announcement of BOA CI-, BOA BENIN and BOAS to proceed to the free distribution of one (1) new share for an old share to each of its shareholders, arouses a craze among investors. The latter unfortunately misinterpret the transaction and are also misled by many financial advisors on the market.
Only, it is clear that this process was more like a split and offered no substantial benefit to the shareholders. And, to drink the chalice to the dregs, investors who participated in this capital increase were freeze half of their investments. The informaction did not appear in any publication of the company.
As an illustration, the investors who participated in the capital increase of BOA BURKINA FASO before the date of secondment of the right of attribution, the 26 June, saw half of their investments frozen until the date of the 04 september. The share price has thus been changed from 100 000 FCFA to 79 000 FCFA, ie a decrease of 21.00%.
Hypothesis : BOA securities at one time had great investor confidence and supported the performance of the BRVM’s finance sector. Investors who felt cheated by this financial communication from the firm sanctioned BOA securities.
As a result, all BOA shares recorded a sharp decline, creating a snowball effect and a reluctance on the part of some investors. Even at this time, the BOA titles are struggling to take off again.
December, an exceptional month
4 th phase- December 2017: Historical increase of + 8.77%
After several months of collapse, the BRVM recorded its largest increase since 10 years during the month of December 2017. This surge in prices seems to be justified by the sharp decline in the stock market since the beginning of the year as well as the craze created by the introduction of ECOBANK-CI on the stock market. As the Director of the BRVM said, it was the best time to buy after this sharp drop.
Technically, we see December 2017 as the second month of the year when the market was in an overbought zone, well above its 20 moving average.
Hypothesis : Fund managers and other insurers took advantage of this opportunity to compensate / reduce their loss. December is also the month of the payment of bonuses in the region, this is seen by the largest transaction in value of the year.
After having analyzed the different events that have influenced the BRVM, the second part of this file will focus on a sectoral analysis of the BRVM and the interpretation of the evolution of the companies that have been the stars throughout the year.
The authors of this analysis are:
Daniel Aggre (above), Managing Director and Founder of Sikadvisory and Ahmed Diallo (Financial Analyst)


